Combining Trendfollowing and Economic Indicators (Apr 28)
Recently, two blogs that I follow, Investing for a Living (Paul Novell) and Philosophical Economics (“Phil”), have each authored a series of excellent articles on macroeconomic-based trading indicators. I do not have any affiliation with these blogs or authors. Another site/service that I do pay for, but have no other affiliation, AllocateSmartly, has summarized Phil’s research into a tracked strategy and post.
I am not sure if Phil is a he or a she. Given that I am referring to the author as Phil, I will use the he pronoun.
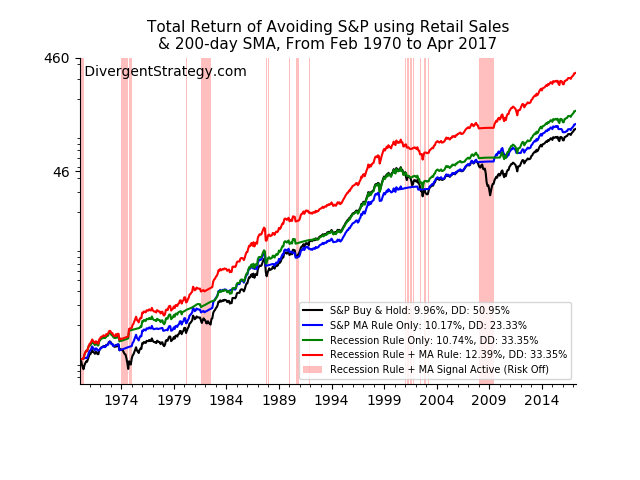
Phil and Novell each try to improve on the classic “trend-following” 10-month (alternatively, the 200-day) moving average rule by introducing an additional rule; if one or more of a group of economic indicators are recessionary, then use the moving average of the S&P 500 to stay invested or divest from stock asset classes. If a recession is not indicated, stay invested. There are not that many signals over a decade, so the system is very long term.
After reviewing, I found that:
- The approach does seem very effective at improving outcomes, with less baggage one must carry when trying to time the market (overfitting, trading costs such as slippage and commissions);
- I was left with a few unanswered questions;
- I wanted an apples-to-apples comparison between the authors’ respective approaches;
- and I wanted to monitor the peformance of this strategy going forward. I will continue to update and repost on it on a monthly basis.
Philosophical Economics’ GTT
Developing a long-term stock market timing signal is difficult, because the signal doesn’t necessarily match well to the antics of the market. You can be too early, too late, or even wrongly exit the market on a false positive (and miss a rally!). This is true of the robust 10-month moving average rule, despite its popularity.
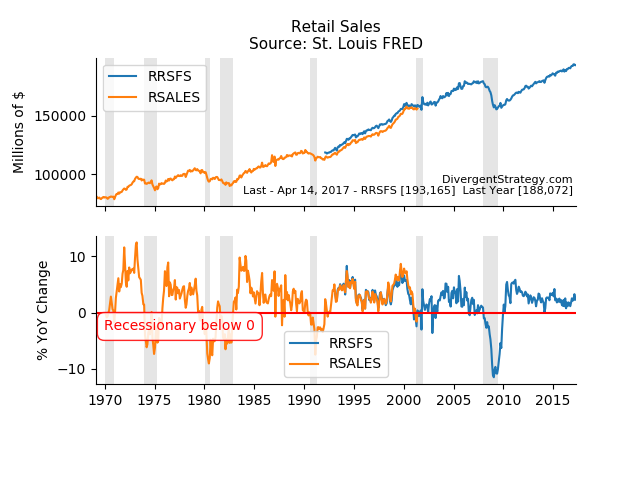
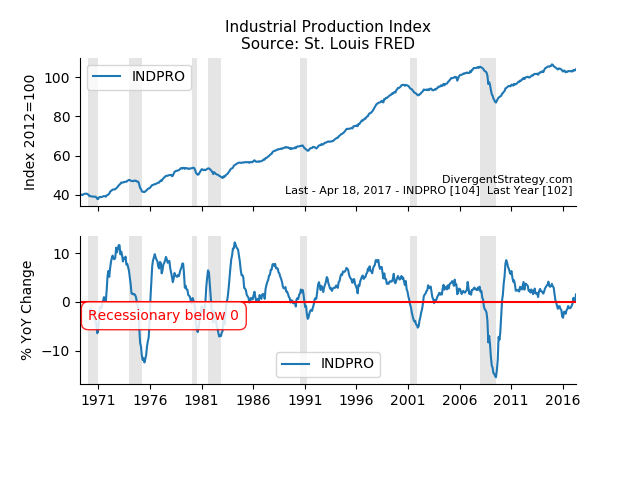
Phil goes into a great level of detail thinking about why this is, how to fix it, and why his solution “Growth-Trend Timing” (GTT) is robust compared to typical approaches. In researching the signals for GTT, he goes through a number of economic indicators, reviewing the intuition and performance of each. What falls out of the research is a composite of two different indicators; one consumer-based (Retail Sales) and one production-based (Industrial Production).
There are several major takeaways from Phil’s work:
- Using a composite of multiple economic indicators improves results and makes intuitive sense
- Economic indicator timing does not work with individual stocks
- Timing does work on overseas markets using US indicators
- Monthly signals are slightly better than daily
- Switching to fixed income investments (when not invested in stocks) improved returns considerably (1-2% annualized over almost 50 years) vs cash
A few notes on GTT:
- AllocateSmartly’s member area shows that the strategy may suffer from turn-of-the-month (TOM) effects. By changing the day used to execute on a monthly signal, the annualized return may fall up to 1%. However, GTT is not as sensitive to TOM as other strategies I have seen on AllocateSmartly.
Updated GTT performance:

Novell’s SPY-UI & SPY-COMP
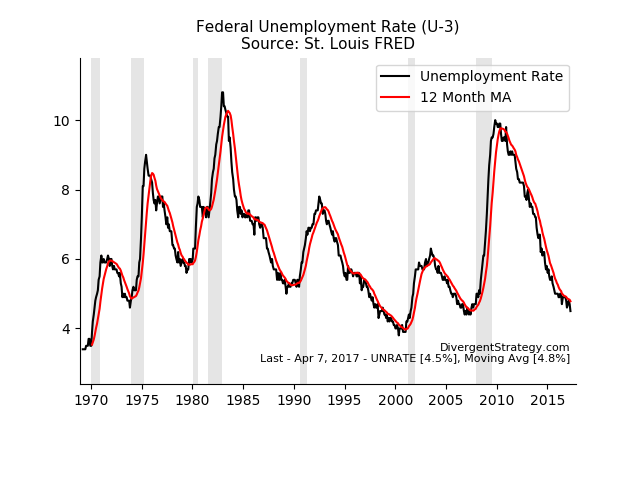
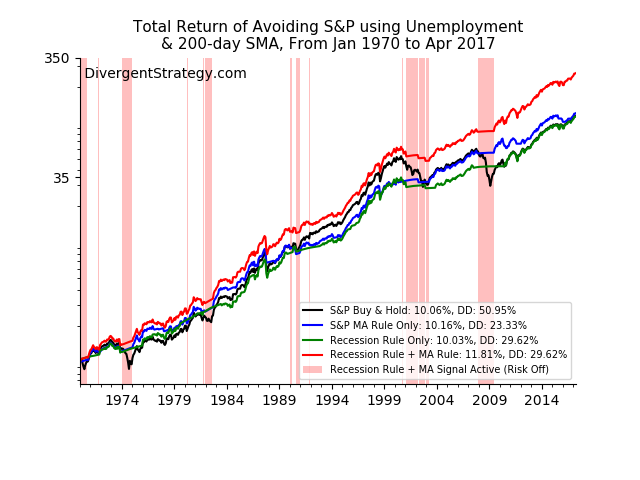
Novell built on the idea put forward by Philosophical Economics. His approach included focusing on only unemployment for SPY-UI and using more economic indicators for SPY-COMP after reviewing many, many indicators. He also “tuned” the threshold parameter for a few of these indicators, to better line up with recessionary conditions. I understand his thinking; not every recession that leads to a bear market is going to be the same, so it is important to diversify the signal.
There are a few takeways from Novell’s work:
- It is possible to reduce the drawdown further, compared to the GTT strategy
- Following more indicators, that are unrelated, makes intuitive sense to catch the next recession
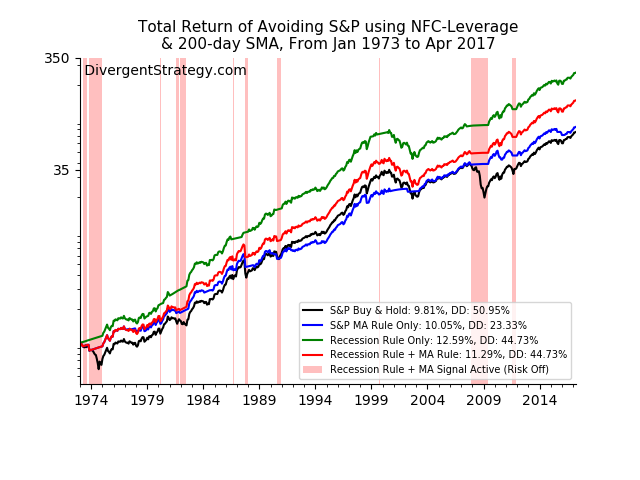
- If watching for a recession signal on a monthly basis, and entering and exiting the market on a daily basis with the 200-day moving average, you might have sidestepped the 1987 crash. If, instead, you only checked monthly for both sets of signals, you would have stayed long through the crash
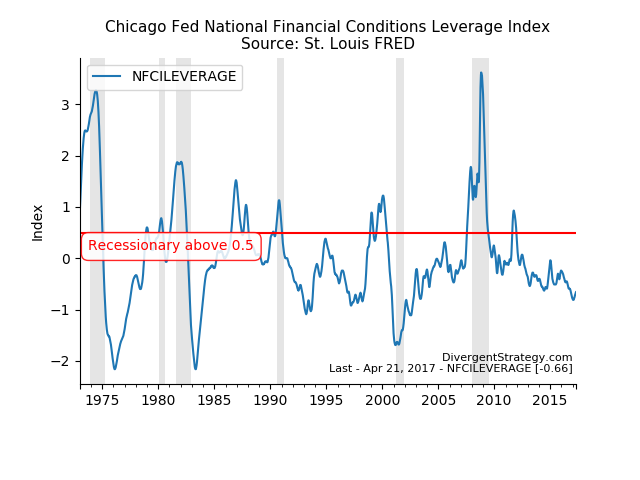
- NFC Leverage is a good recession indicator on its own, but as part of SPY-COMP, it does not add or detract. This may change in the future…
I also have a few notes on Novell’s posts:
- Novell’s returns are much higher (and drawdowns lower) for SPY-UI and SPY-COMP than my backtests
- I consider AllocateSmartly.com to be the gold standard of backtests. My returns are on par with Phil’s own work and AllocateSmartly for GTT, but using the same methodology, my returns are much lower than Novell’s backtests
- These differences may be due to Novell executing on his signals differently (less lag?)
- Using more indicators may increase Type I & Type II errors slightly due to overfitting. However, this should be mitigated by the presence of the 200-day rule, so I am not too bothered by this
Updated SPY-UI performance:
Updated SPY-COMP performance:

A Few Notes on my Backtests
My underlying returns data is not based on SPY; it is based on an approximation of the total return of the S&P 500 index using Robert Shiller’s dividends and the ^GSPC data from Yahoo. When the economic indicator rule and the 10 month moving average rule signal risk off together, I assume capital is invested in 3 month Treasury bills. My backtests do not include taxes, fees, commissions, or the expenses embedded in SPY. Actual returns will be worse than shown here.
I looked at combining GTT with Unemployment, which I have labeled GTT-UI. This had little-to-no-effect. I could go through more iterations and permutations of indicators, but this is overfitting. As you can see below, there is little difference between the different flavors of the overall strategy. Where GTT has a slightly higher annualized return, SPY-COMP has a slightly lower drawdown. Finding the right version/combination of indicators = luck; past performance has no bearing on and is not indicative of future results!

Breaking Away
Novell’s SPY-COMP approach may better adapt to our changing economy, but the simplicity of Philosophical Economics’ GTT resonates with me. In the end, it is worth paying attention to both – they both are effective at reducing drawdowns considerably from buy & hold, which I see as the primary benefit. Last thought – my inner skeptic was really disarmed by Philosophical Economics’ original post. The theory and intuition in bringing this strategy forward from first principles is rare.
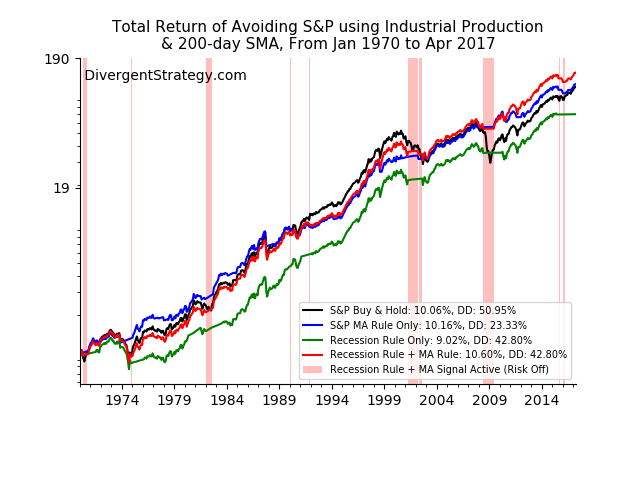
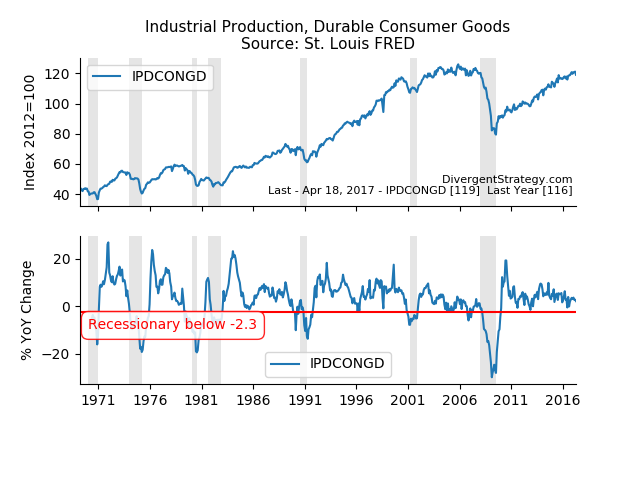
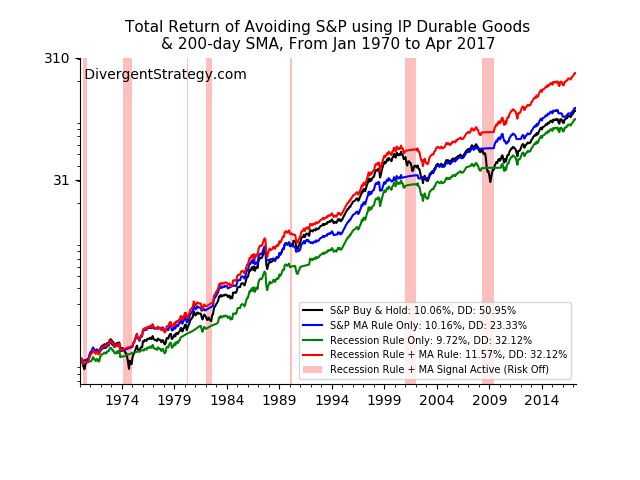
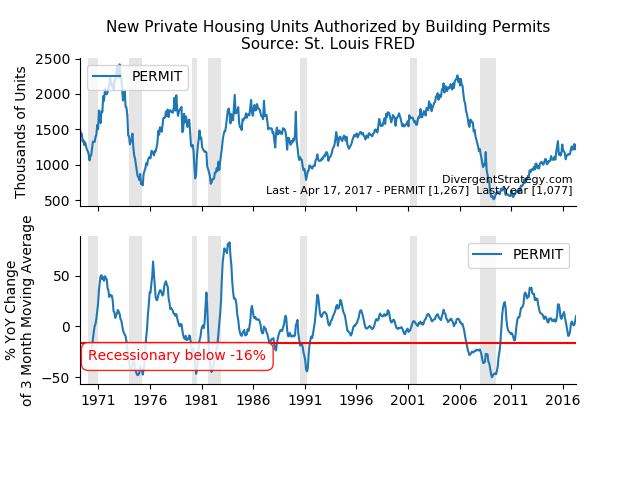
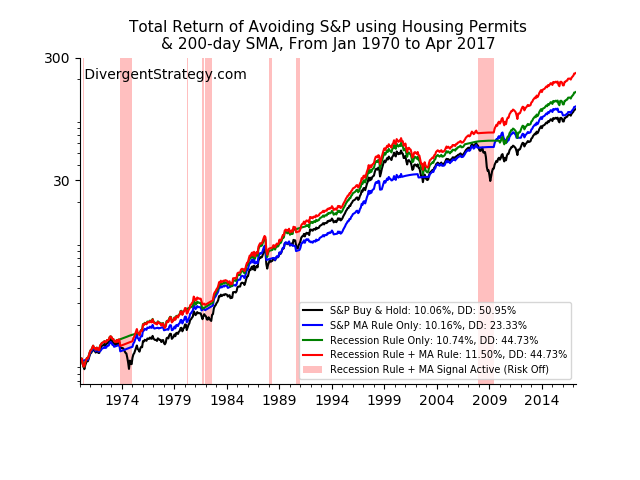
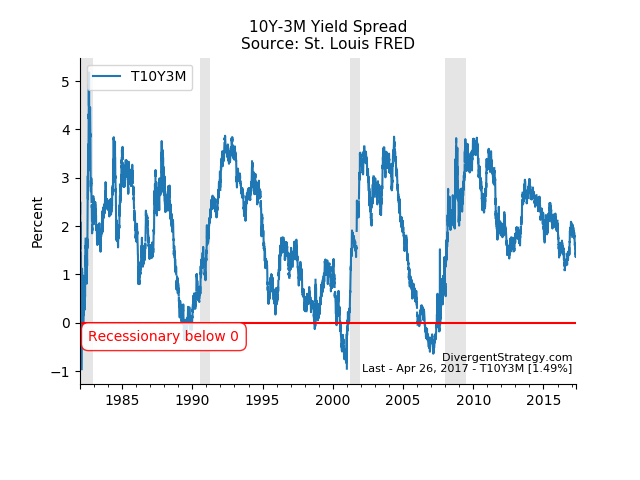
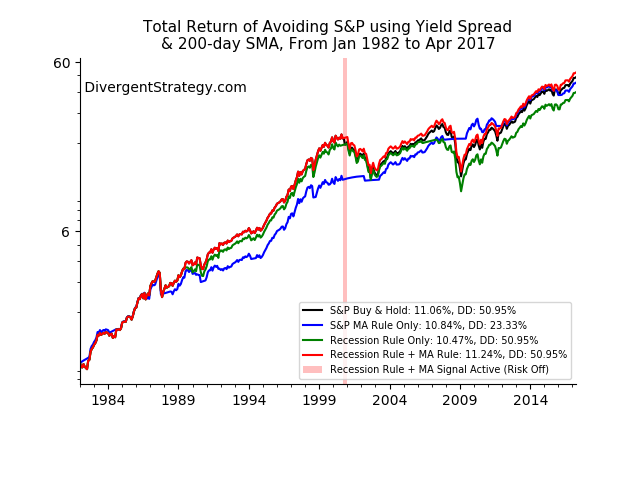
Below you will find a series of updated economic indicators and their solo performance as a market timing signal. I intend to monitor these in addition to the composite indicators mentioned above.
(Disclaimer: Market timing involves risks. This is not a recommendation. Further, this is not professional investment advice. I am expressing an opinion and make no representations as to the accuracy, completeness, suitability, or validity of any of the information presented.)
